粘土質土壌粒子の表面処理による蒸発による水分損失の低減
Y. Asanuma, K. Toyota, T. Nishimura, I. W. Lenggoro, Advanced Powder Technology doi.org/10.1016/j.apt.2022.103465 Open access.
農業生産や造園で使用される水の利用効率を高めることは重要である。しかし、土壌表面からの水分蒸発を制御するために一般的に使用されているプラスチックマルチ(シート)は、廃棄物や生態系への影響が大きいという問題がある。そこで、私たちは、シランカップリング剤でコーティングした天然(沖縄県)の粘土質土壌が水分蒸発を抑える効果があることを見出した。粒径200~500 µmの土壌の疎水性を高めることができる。蒸発フラックスは、一定の風速、温度、相対湿度を保ったチャンバー内に置いた電子天秤を用いて調べた。コーティングした土壌層を系に配置することで、蒸発フラックスの大きさを調整することができる。コーティングした土壌層は水の毛管現象と相互作用して蒸発フラックスを減少させることが明らかになったが、水蒸気の拡散に及ぼす効果は小さいことが分かった。この技術は、淡水資源の有効利用に貢献する可能性のある新しい技術である。しかし、実際の作物に適用する場合には、コーティング剤の選択やスケールアップなど、まだ解決すべき課題が多くある。
To conserve water in crop production and landscaping, plastic mulch or sheets are commonly used. However, the environmental impact of plastic waste is a concern. Therefore, herein we report that a silane coupling agents-based coating can be applied to natural clayey soil samples. This coating suppresses water evaporation. The hydrophobicity of soils (particle sizes 200–500 µm) can be enhanced. Evaporation flux was investigated using an electronic balance placed inside a chamber by maintaining constant flow, temperature, and relative humidity. The magnitude of evaporation flux was adjusted by placing a hydrophobic-treated soil layer in the system. It is clear that the hydrophobic-treated soil particle layer interacts with water capillaries to reduce the evaporation flux, but the effect on water vapor diffusion was small.
私たちの研究室からは初めての土壌を用いた研究成果です。This is the first study using soil from our lab.
The main researcher is Yosuke Asanuma (Doctoral student) and our collaborators are Prof. Koki Toyota (School of Agriculture, TUAT) and Prof. Taku Nishimura (School of Agriculture, Univ. of Tokyo)
Publication: Surface treatment of clayey soil particles for reducing water loss through evaporation (Y. Asanuma, K. Toyota, T. Nishimura, I. W. Lenggoro), Advanced Powder Technology (Journal of The Society of Powder Technology, Japan)doi.org/10.1016/j.apt.2022.103465 Open access.
Temporal changes in soil layers during evaporation tests 蒸発試験中の土壌層の時間的変化

Surface treatment of clayey soil particles for reducing water loss through evaporation
Yosuke Asanuma1, Koki Toyota1,2, Taku Nishimura3, I. Wuled Lenggoro1,2,4
1Graduate School of Bio-Applications and Systems Engineering, Tokyo University of Agriculture and Technology (TUAT), 2-24-16 Naka-cho, Koganei-shi, Tokyo 184-8588, Japan
2Institute of Global Innovation Research, TUAT, 3-8-1 Harumi-cho, Fuchu-shi, Tokyo 183-8538, Japan
3Department of Biological and Environmental Engineering, Graduate School of Agriculture and Life Sciences, The University of Tokyo, 1-1-1, Yayoi, Bunkyo-ku, Tokyo 113-8657, Japan
4Department of Applied Physics and Chemical Engineering, TUAT, 2-24-16 Naka-cho, Koganei-shi, Tokyo 184-8588, Japan.
ABSTRACT: To conserve water in crop production and landscaping, plastic mulch or sheets are commonly used. However, the environmental impact of plastic waste is a concern. Therefore, herein we report that a silane coupling agents-based coating can be applied to natural clayey soil samples to suppress water evaporation. The hydrophobicity of soils (particle sizes 200–500 µm) can be enhanced. Evaporation flux was investigated using an electronic balance placed inside a chamber by maintaining constant flow, temperature, and relative humidity. The magnitude of evaporation flux was adjusted by placing a hydrophobic-treated soil layer in the system. It is clear that the hydrophobic-treated soil particle layer interacts with water capillaries to reduce the evaporation flux, but the effect on water vapor diffusion was small. 農業生産や造園で水を節約するために、プラスチックマルチやシートがよく使われる。しかし、プラスチック廃棄物の環境への影響は懸念される。そこで、本研究では、シランカップリング剤を用いた塗布法で天然の粘土質土壌に水分蒸発を抑制する効果を与えることができることを報告する。粒径200~500 µmの土壌の濡れ性を高めることができる。蒸発フラックスは、一定の流量、温度、相対湿度を保ったチャンバー内に置いた電子天秤を用いて調べた。塗布した土壌層を系に配置することで、蒸発フラックスの大きさを調整することができた。塗布した土壌層は水の毛管現象と相互作用して蒸発フラックスを減少させることが明らかになったが、水蒸気の拡散に及ぼす効果は小さいことが分かった。
Keywords: fluid, hydrophobic, hydrophilic, powder, vapor
1. Introduction
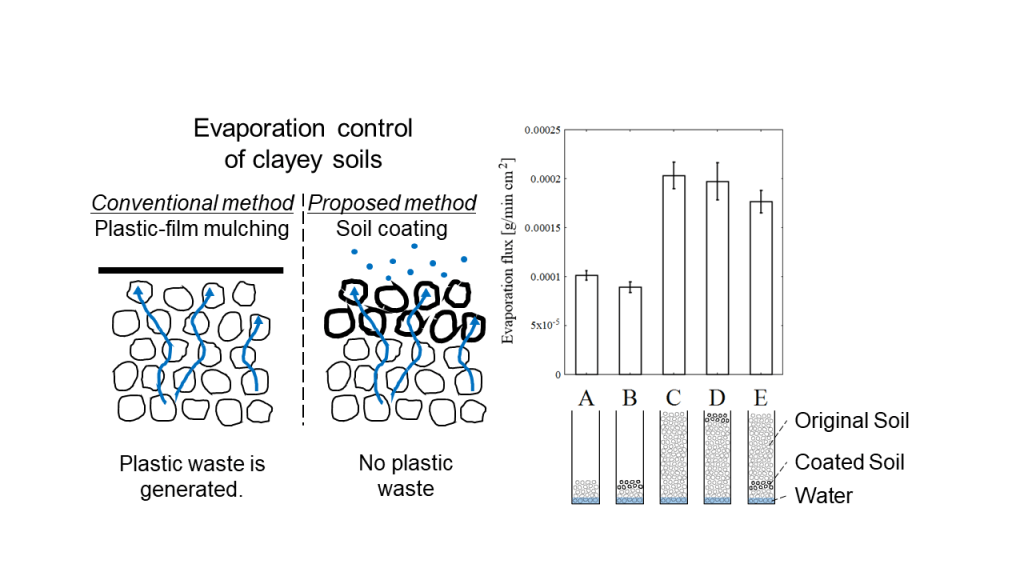
As the demand for freshwater increases owing to population growth and industrial usage, it is becoming challenging to optimize the use of freshwater to a sustainable level, and doing so is urgent, especially in arid or semi-arid regions [1]. Increasing the productivity of rain-fed water used for agriculture is one of the important strategies for reducing the impact of human activity on limited freshwater resources [2]. Plastic sheeting (mulching) is one of the practical methods being used in agricultural production to control water evaporation from the soil surface. This method has positive effects on water evaporation and temperature control, but the method generates waste plastic and affects ecosystems [3, 4]. To suppress water evaporation without mulching the soil surface, alternative basic research is required.
To reduce the water evaporation, several researchers have reported modified soil wettability by applying chemical (e.g., silane-based surfactant) coatings on sands and glass beads (model sands) [5, 6]. However, studies involving clayey soils, which are usually suitable for agricultural production, and the role of wettability in soil systems have not been reported thus far. In the present study, we propose a method to suppress water evaporation from soil, without using any plastic-film mulch system and maintaining “real” agricultural conditions, by applying chemical coatings to clayey soil and to understand the effects of different levels of wettability on the water evaporation process.
2. Experimental methods
The clayey soil samples used herein were collected from Kitadaito island, Okinawa Prefecture, Japan. The samples were air-dried for more than 2 weeks in our laboratory and sieved to 200–500 µm. The original/natural soil was hydrophilic, and its composition was as follows: sand = 1.3 %, silt = 11.1 %, and clay = 87.6 % [7]. Density of the soil was 1.32 g/cm3.
The wettability of these soil samples was modified by coating them with a silane coupling agent. N-octyltriethoxysilane (Alfa Aesar Co. Ltd., U.K.), 2-propanol, and hydrochloric acid (Wako Co. Ltd., Japan) were used in the coating process. This silane coupling agent has been reported to be suitable for the coating of model soils (glass beads and sand) [5]. N-octyltriethoxysilane was diluted with absolute 2-propanol to a concentration of 1 wt.% with 2 wt.% distilled water and 0.2 wt.% hydrochloric acid (37 wt.%) under magnetic stirring for 5 h [8, 9, 10]. The reason why hydrochloric acid was added is because an acidic environment is necessary for the hydrolysis of the ethoxy groups of silane. Representative samples (30 ml solution and 1.0 g soil) were mixed gently in beakers for 1 h. After removing the liquid, the soil sample was dried under ambient conditions (around 25oC) for 15–20 h. The coated soil sample was used within 5 days.
Before Coating After Coating
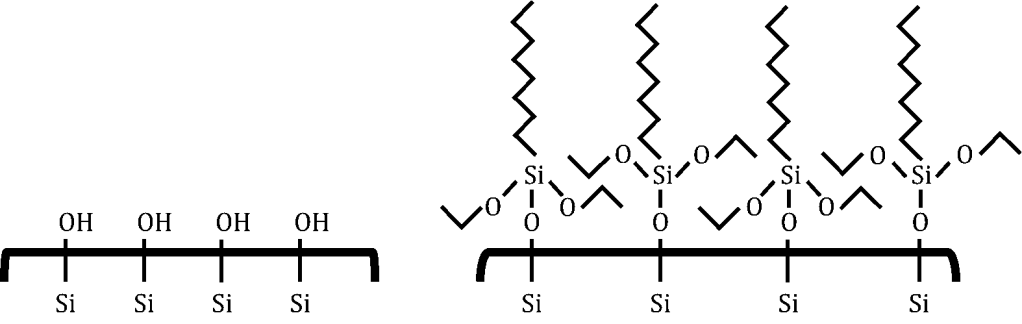
Figure 1. Structure of soil surface: Before and after coating with silane-coupling agents.
Figure 1 shows the mechanism of coating the silane-coupling agent on the soil surface. The silicate structure of the original soil surface consists of –OH groups, which impart hydrophilicity to the soil surface. When the surface is coated with silane, a monolayer of the alkyl group is developed, and it imparts the hydrophobic surface characteristics [6].
Soil morphology before and after application of the coating was observed using an optical microscope and a scanning electron microscope (SEM, JEOL, Ltd. Japan). Soil pH was measured with a commercially available pH meter (LAQUA twin-pH-22, HORIBA Scientific, Japan). The planar sensor makes it easy to measure the pH of the soil by simply placing the soil on the sensor and dripping water.
To investigate the wettability of the soil sample, we used the water droplet penetration time (WDPT). The WDPT method measures the time required for water to penetrate a soil sample [11, 12, 13]. A 0.40 g soil sample (original or coated) was pressurized at 71 MPa to make tablets. The diameter, height, and volume of the tablets were 15.00 mm, 1.25 mm, and 0.19 cm3, respectively. Using the bulk density of soil (2.08 g/cm3 measured) and the density of soil particles (2.80 g/cm3 [7]), the porosity of the tablet prepared in the present study was calculated to be 25.65% according to the calculation method of previous studies [14]. 1 µl of water was dropped on each sample by using a syringe, and the resulting penetration time was measured.
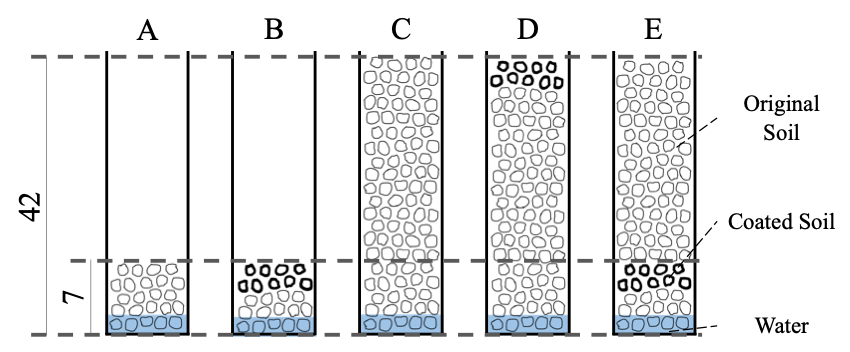
Figure 2. Patterns of soil structures.
The effect of the ratio (as thickness) of the coated soil samples to the original soil has already been discussed in an earlier study [5]. Using a model soil (silica sand), Shokri et al. [5] reported that the thicker the coated soil layer, the less water evaporation from the soil sample. We followed the structural ratio (layer thickness) of [5]. Five different (height) soil structure patterns were designed to investigate the role of the coated soil layer within each structure (Fig. 2).
The soil samples were placed in an “open-top” observation cell (transparent, polystyrene, length: 10 mm, width: 10 mm, height: 45 mm). Pattern A consisted of a 7-mm-thick layer of the original soil. Pattern B consisted of 5 mm of the original soil covered with a 2-mm-thick layer of the coated soil. Pattern C consisted of 42 mm of the original soil. Pattern D consisted of a 40-mm-thick layer of the original soil covered with a 2-mm-thick layer of the coated soil. Pattern E consisted of a 5-mm-thick layer of the original soil and a 2-mm-thick layer of the coated soil covered with a 35-mm-thick layer of the original soil. The packing densities in each structural pattern were 0.75[-] (for patterns A and B) and 0.69 [-] (for patterns C, D, and E).
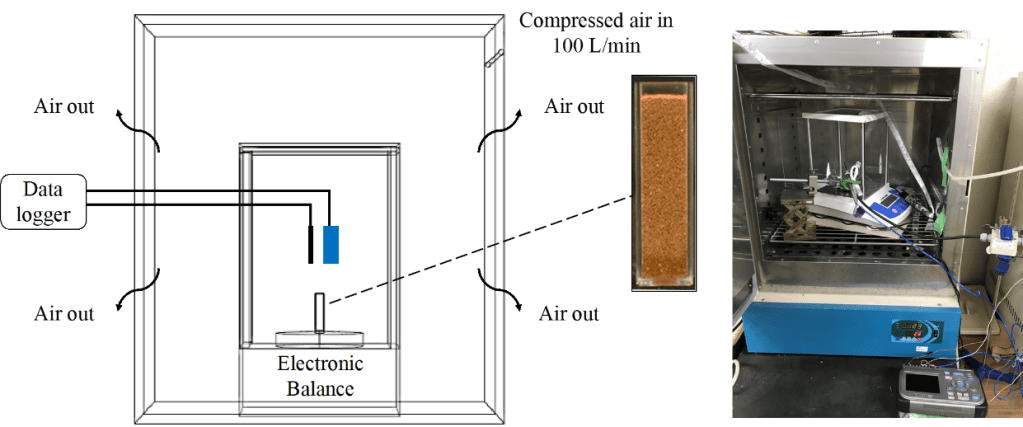
Figure 3. Schematic illustration and photograph of a soil sample and the experimental chamber.
The evaporation experiments were carried out in a chamber (Fig. 3). The evaporation time was 5 h for each experiment. Dry air was introduced into the chamber to maintain the temperature at 30.0 ± 0.49 ℃ and relative humidity lower than 5%. The values of these quantities were monitored using suitable sensors and a data logger. The chamber was not hermetically sealed to prevent changes in air pressure inside. The mass of the samples was directly measured using an electronic balance placed inside the chamber. A digital camera was used to capture horizontal images of the soil samples. For further image processing, two open-source software applications (ImageJ ver. 1.52a and INKSCAPE ver. 0.92) were used. [15, 16].
The air flow pattern inside the camber was simulated using a computational fluid dynamics software application (COMSOL Multiphysics). Dry air was introduced into the chamber through a plastic tube and discharged from the chamber through a small gap in the chamber door. The plastic shield of the electronic balance prevented air from reaching the surface of the soil sample. A representative numerical simulation result is presented in Fig. 4.
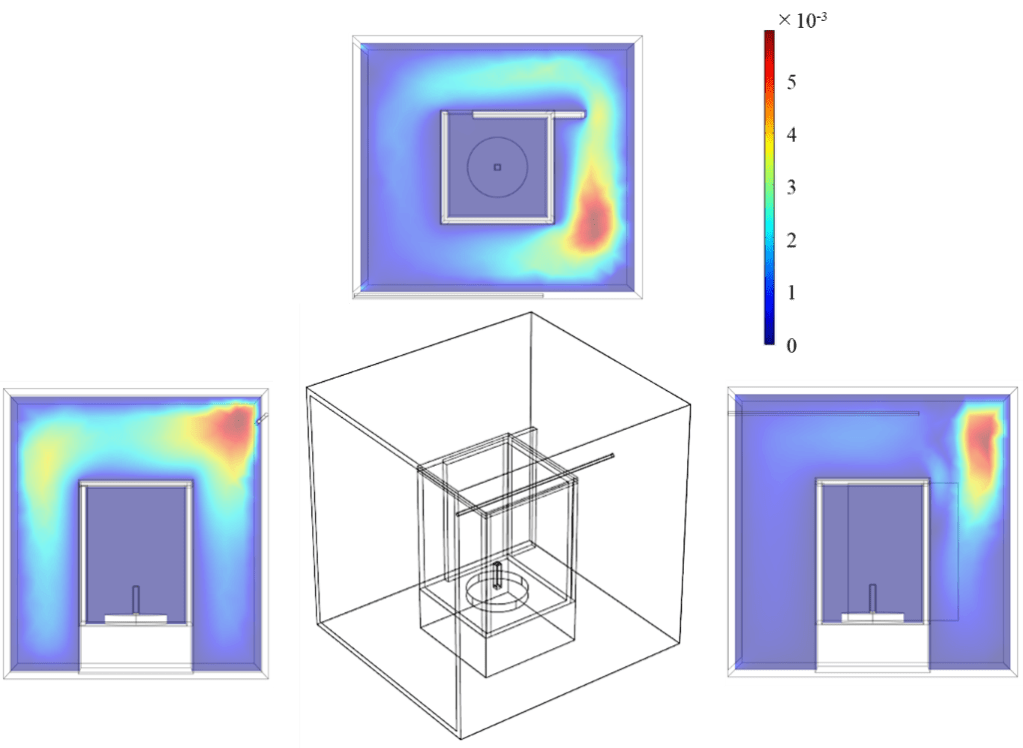
Figure 4. An example numerical simulation result of the flow regime inside the chamber.
To measure the relative importance of advection (convection rate) versus diffusion, the Peclet number (Pe) was calculated using the following equation [17, 18, 19].
・・・(1)
where is the characteristic velocity (wind velocity), is the characteristic length, and is the diffusion coefficient of water vapor. Pe was calculated using the airflow value obtained from the numerical simulation. It is well known that a large Pe indicates an advectively dominated distribution, and a small Pe indicates a diffuse flow. In our system, the value of Pe was small at 3.9 × 10⁻⁴ [-] (<< 1). Therefore, the effect of wind near the soil surface was negligible.
3. Results and Discussion
The condition where the coated soil sample became acidic was unavoidable following the previous study. The pH of the original soil was about 5.6, but after coating, it was about 3.0. This pH 3 is undesirable for crops and is known to have a negative impact on nutrient transport. Almost similar to the thickness structures of previous reports, a thin layer (a few mm thick) was inserted between or on top of the uncoated soil layers in the present study. There is of course work to be done in the future, but we believe that the use of this thin layer will reduce the impact of acidification of the system. On the other hand, an example of study on the negative effects of 2-propanol on agricultural crops was reported by Meier et al. [20]. They reported that 5 g (2-propanol)/kg (dry) of sand reduced germination and root growth of lettuce (Lactuca sativa) and oat (Avena sativa) seeds. In our experiment, most of the 2-propanol may have evaporated from the soil samples because the drying process was also applied to the coated soil samples at room temperature.
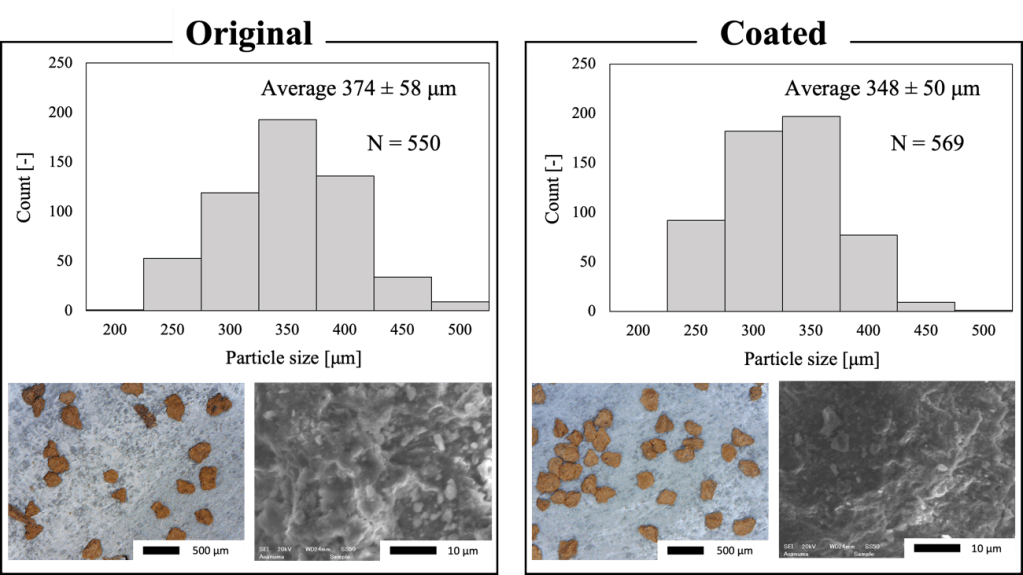
Figure 5. Particle size distributions (Upper), SEM images, and optical microscopy images of original soil (Left) and coated soil (Right).
According to the measured particle size distribution (Fig.5), the average size of soil particles was found to be 374 ± 58 µm (before coating) and 348 ± 50 µm (after coating). The reason for the slight change in the particle size distribution could be due to the effect of “washing” by the solid-liquid mixing and separation processes. SEM observations confirmed that the fine particles on the soil particle surface were removed after coating process. Since the size of the particles before and after coating both had peak values within the 300-400 μm range, the effect of the coating process on the physical properties of the soil particles was not considered.
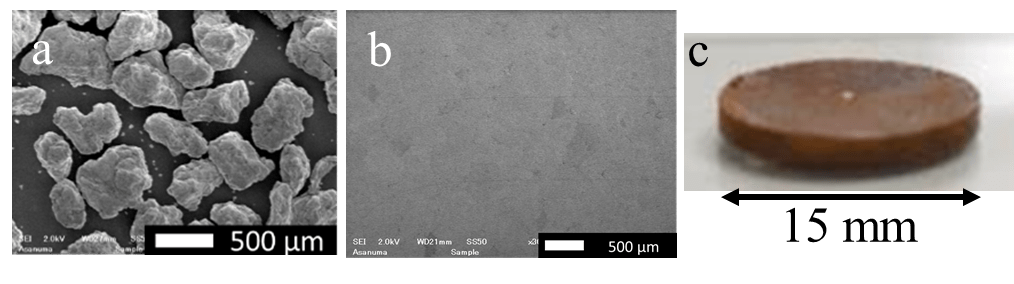
Figure 6. SEM images of the original (uncoated) soil samples before (a) and after (b) compression. A photograph of compressed sample (c).
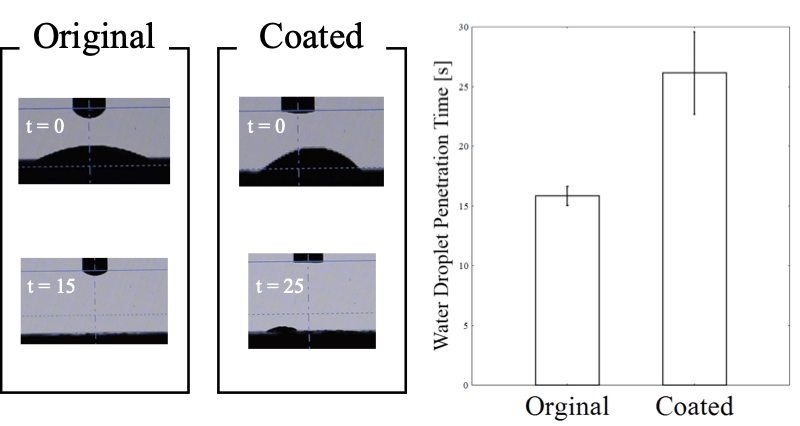
Figure 7. Examples of WDPT test conducted using original and coated soil samples.
During the WDPT method, we observed the soil samples before and after compression by using a SEM (Fig. 6. a, b) and a digital camera (Fig. 6. c). We confirmed that the compression operation eliminated the inter-particle gap to some extent. Fig. 7 shows a result obtained using the WDPT method. The time required for water droplets to penetrate the soil sample was 10–15 s longer in case of the hydrophobically coated soil than in case of the original soil. Thus, it can be concluded that the silane coating decreased the wettability of soil particles.
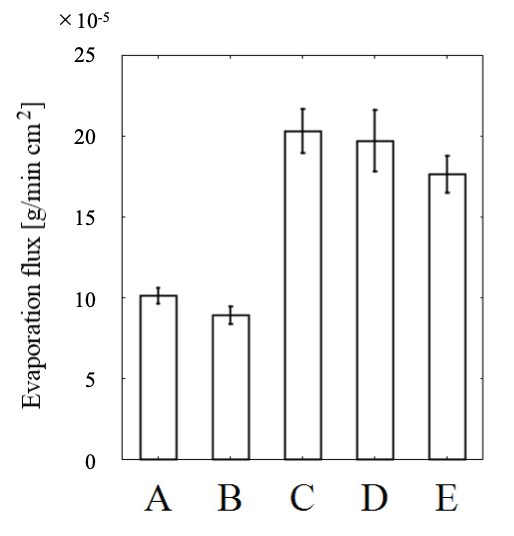
Figure 8. Evaporation fluxes calculated using five different soil structures (A–E). By using different specimens, each soil structure was tested thrice.
From the evaporation experiments, the evaporation flux [g / m cm2] was calculated based on the change in soil sample weight before and after evaporation (Fig.8). Each soil structure was tested thrice by using different specimens. In case of the structures with 7 mm height (A: original soil and B: 5 mm original soil covered with 2 mm coated soil), water was lifted until the soil surface by capillary force, and the evaporation “interface” was observed on top of the soil surface. For the other structures with the height of 42 mm (C: original soil, D: 40 mm original soil covered with 2 mm coated soil, and E: 5 mm of original soil and 2 mm of coated soil covered with 35 mm of original soil), water was lifted up to approximately 10 mm, and the evaporation “interface” was observed in the intermediate layer, not on the topmost soil surface.
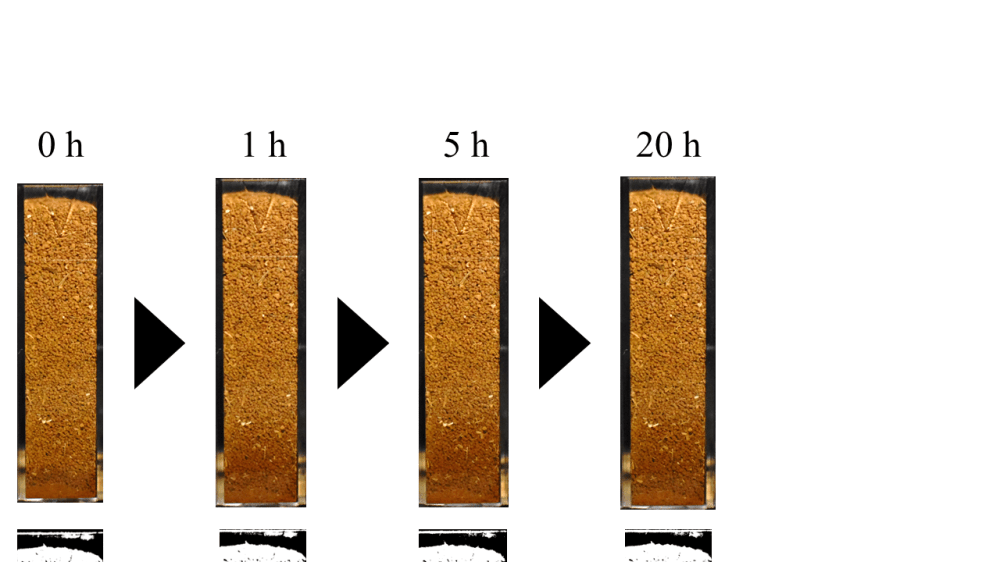
Photographs (Fig. 9) shows how water was lifted by capillary force with the passage of time. Images of the soil samples during the evaporation experiments (Fig.9 Upper) were obtained using a digital camera. The images were converted into binary format (Fig. 9 Middle) to clarify the height of the capillary water at each point of time. The lower panel (Fig. 9) shows the 8-bit binary image that erases the image at the start (0 h in the middle) from the image at the elapsed time (1 h, 5 h, and 20 h in the middle). The images in the lower panel indicate the change in the height of the capillary water with the passage of time. Water was lifted up for 5 h, and the final height of the capillary water was approximately 10 mm.
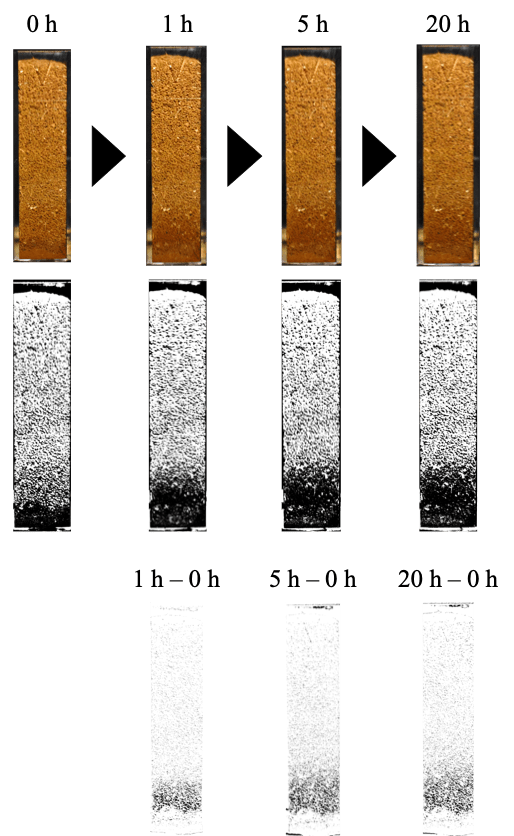
Figure 9. Images of water movement (capillary) in structures with height of 42 mm (C, D, and E). Upper: Digital camera, Middle: 8-bit binary, Lower: 8-bit binary with image at the start (0 h in the middle) erased from the image at the elapsed time (1 h, 5 h, and 20 h in the middle).
The results exhibited a trend similar to those recorded in previous studies, in which glass beads or natural sands were used [5, 21, 22]. One of the major differences between glass beads, natural sand, and the clayey soil used herein was porosity. Clayey soils are composed of “aggregates” of fine particles, while sand itself is one of the particles of crushed stone or artificial glass beads, and it is not porous. The porosity differences influence water flow during the evaporation process. In clayey soils, the proportion of fine particles is higher, particles are packed tightly, less air is trapped between the particles, and as a result, clayey soils can hold more water than most other types of soil.
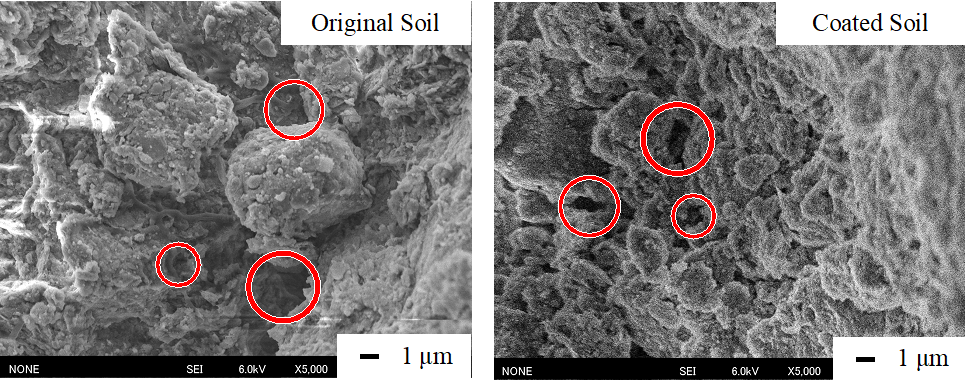
Figure 10. SEM images of original (Left) and coated (Right) soil particles. Red circles: micro-scale pores.
In case of the experiments conducted using glass beads [21], water did not penetrate into the glass beads but flowed through the gaps between the glass beads. In the present study, where we used a natural clayey soil, we observed that the soil particles contained many micro-scale pores (Fig. 10 SEM images). In this condition, water was thought to be lifted through the pores in the soil particles [23].
The evaporation mechanism in each structure is illustrated in Figure 11. We confirmed that the evaporation surface area was one of the important parameters governing the evaporation flux. Moreover, we found that the soil layer coated with the silane compound effectively reduced the evaporation flux in certain soil structures.
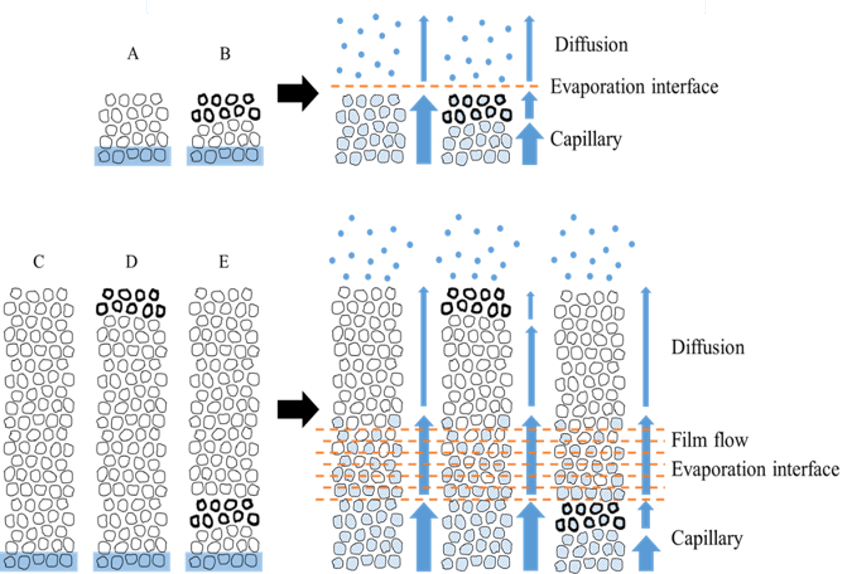
Figure 11. Schematic diagram of evaporation mechanism in each soil structure.
Differences between the soil samples in terms of height and evaporation surface area caused significant differences in the water evaporation rate [24, 25]. In cases of the two structures with the original soil, water evaporation was slower in structure A (7 mm height) than in structure C (42 mm height) because the areas of the evaporation “interface” in the two structures were different. Another reason is the difference in the evaporation surface area of water. Notably, the difference between the two structures (A and C) in terms of diffusion flux is negligible.
Following Fick’s law, the water diffusion flux of structure A was found to be 0.0060 and that of C was found to be 0.0033 when the relative humidity inside the soils was 50 %. The water vapor diffusion flux of structure A was higher than that of structure C, but the water evaporation flux of structure A was considerably lower than that of structure C. Fig. 11 shows that the capillary movement of water and the typical height of the unsaturated zone was approximately 10 mm according to image analysis (Fig. 9). Since the capillary potential in structure A was 10 mm and the soil height was 7 mm, the area of the evaporation interface in structure A was smaller than that in structure C (42 mm height), resulting in a difference in terms of the water evaporation flux between structures A and C.
According to the results obtained for structure B, the coated soil layer (2 mm in thickness in 7 mm in total height) can reduce water evaporation by 11.7% compared to structure A (original soil) for the same height (7 mm). Water evaporation in structure E, which included an inserted 2-mm-thick layer of coated soil, was 13.2% less than that of structure C with the same height of 42 mm. In the structures with a 2-mm-thick layer of coated soil (structures B and E), capillary water passed through the coated soil layer. This means that the coated soil does lift water through the microscale pores in the soil particles, but the coated soil layer exhibited a certain effect of reducing the evaporation flux of water in the early stages of evaporation. By contrast, in structures C and D (height of 42 mm), when the bulk water was not in contact with the coated soil layer, the coated soil layer was able to reduce the evaporation flux by only 2.94%. This suggests that the coated soil layer can intercept capillary water but cannot “stop” the transport of water vapor.
In the future, it is necessary to evaluate the effects of silane coupling reagents on crops in order to consider soil coating for actual agricultural applications. Gupta et al., demonstrated the effects of silane compound coating on sandy soil (sand 78%) on the growth of plant (chick pea (Cicer arietinum)) [6]. Their results reported that covering the system with the coated soil significantly increased plant growth (root length, number of branches, number of leaves, etc.) compared to the uncovered soil system. Coating the soil reduces evaporation, increases the water supply to the plants, and consequently promotes plant growth. However, the coating method proposed in previous studies, which is also the procedure we followed, uses hydrochloric acid and 2-propanol, which are not harmless to plant growth. In the future, it is recommended to be able to produce conditions where the pH of the soil is close to neutral, and also to use low-cost alternative solvents such as water (as the main component).
Another item to be considered throughout the present study is the quantification of the silane coupling agent. Unlike the model soils used in previous studies (glass beads and sand), the natural clay soil particles used in the present study are a multi-component material containing numerous organic materials. We had tried several analyzers at our university, but they did not give us the desired results regarding the quantitative analysis of the coatings. Quantitative analysis is important for assessing the material balance of the system and will be our next challenge.
4. Conclusion
In the present study, we made the first attempt to use chemical coating technology to control water evaporation from clayey soils obtained from real environments. Although the evaporation mechanisms of the model soil (glass beads) and the real soil were different, the proposed coated soil layer performed as well as previously reported (using the model soil). The results obtained herein indicate that the coated soil layer suppressed the capillary action of bulky water, but it had little effect on the diffusion of water vapor. Moreover, the evaporation surface area of water significantly influenced the evaporation flux. Considering the application of the present approach using actual crops, there are still some issues to be considered, especially in the selection of coating reagents. Research and development on scale-up is also an issue for the future.
本研究では、実際の環境から得られた粘土質土壌からの水分蒸発を制御するために、化学物質を塗布する技術を初めて試みた。モデル土壌(ガラスビーズ)と実際の土壌では蒸発機構が異なるが、提案した塗布土壌層は、以前報告されたもの(モデル土壌を使用したもの)と同等の性能を示した。本研究で得られた結果は、塗布土壌層は塊状水の毛管現象を抑制したが、水蒸気の拡散にはほとんど影響しなかったことを示している。また、水の蒸発面積は蒸発フラックスに大きく影響した。実際の作物に本手法を適用する場合には、特に塗布剤の選択に関して、まだ考慮すべき問題がある。スケールアップに関する研究開発も今後の課題である。
Acknowledgements
We gratefully acknowledge funding by the JSPS Kakenhi Grants (Project 20K05188, 21H02193, 20K20358), the Cabinet Office (Government of Japan) Moonshot R&D Program for Agriculture, Forestry and Fisheries (Agency: the Bio-oriented Technology Research Advancement Institution) and the many insightful comments made by Shigeru Masuda, Yoshimitsu Amano, Masaaki Okawara, Hidehiro Kamiya, Hirotaka Saito, Ferry Faizal, and Yuria Watanabe.
Conflicts of Interest
The authors declare no conflict of interest.
References
1. Mekonnen, M. M. & Hoekstra, A. Y. Sustainability: Four billion people facing severe water scarcity. Sci. Adv. 2, 1–7 (2016).
2. Rockström, J., Falkenmark, M., Karlberg, L., Hoff, H., Rost, S. & Gerten, D. Future water availability for global food production: The potential of green water for increasing resilience to global change. Water Resour. Res. 45, 1–16 (2009).
3. Kader, M. A., Senge, M., Mojid, M. A. & Ito, K. Recent advances in mulching materials and methods for modifying soil environment. Soil Tillage Res. 168, 155–166 (2017).
4. Zribi, W., Aragüés, R., Medina, E. & Faci, J. M. Efficiency of inorganic and organic mulching materials for soil evaporation control. Soil Tillage Res. 148, 40–45 (2015).
5. Shokri, N., Lehmann, P. & Or, D. Effects of hydrophobic layers on evaporation from porous media. Geophys. Res. Lett. 35, 1–4 (2008)
6. Gupta, B., Shah, D.O., Mishra, B., Joshi, P.A., Gandhi, V. G., & Fougat, R. S. Effect of top soil wettability on water evaporation and plant growth. J. Colloid Interface Sci. 449, 506–513 (2015).
7. Kawanobe, M., Miyamaru, N., Yoshida, K., Kawanaka, T., Fujita, T. & Toyota, K. Sugarcane yield loss in the ratoon crop carried over from the plant crop damaged by plant-parasitic nematode in a heavy clay field in Okinawa, Japan. Nematol. Res. 49, 1–6 (2019).
8. Plueddemann, E. P. Adhesion through silane coupling agents. J. Adhes. 2, 184–201 (1970).
9. Nguyen, H. H., Wan, S., Tieu, K. A., Zhu, H. & Pham, S. T. Rendering hydrophilic glass-ceramic enamel surfaces hydrophobic by acid etching and surface silanization for heat transfer applications. Surf. Coatings Technol. 370, 82–96 (2019).
10. Zewde, B., Pitliya, P. & Raghavan, D. The role of surface modified TiO2 nanoparticles on the mechanical and thermal properties of CTBN toughened epoxy nanocomposite. J. Mater. Sci. 51, 9314–9329 (2016).
11. Chenu, C., Le Bissonnais, Y. & Arrouays, D. Organic matter influence on clay wettability and soil aggregate stability. Soil Sci. Soc. Am. J. 64, 1479 (2000).
12. Bisdom, E. B. A., Dekker, L. W. & Schoute, J. F. T. Water repellency of sieve fractions from sandy soils and relationships with organic material and soil structure. Geoderma 56, 105–118 (1993).
13. Gao, Y., Lin, Q., Liu, H., Wu, H. & Alamus. Water repellency as conditioned by physical and chemical parameters in grassland soil. Catena 160, 310–320 (2018).
14. Fu, Y., Tian, Z., Amoozegar, A., Heitman, J. Measuring dynamic changes of soil porosity during compaction. Soil Tillage Res. 193, 114–121 (2019).
15. Persson, M. Estimating surface soil moisture from soil color using image analysis. Vadose Zone J. 4, 1119–1122 (2005).
16. Kaestner, A. et al. Mapping the 3D water dynamics in heterogeneous sands using thermal neutrons. Chem. Eng. J. 130, 79–85 (2007).
17. Yiotis, A. G., Tsimpanogiannis, I. N., Stubos, A. K. & Yortsos, Y. C. Coupling between external and internal mass transfer during drying of a porous medium. Water Resour. Res. 43, 1–12 (2007).
18. Gierke, J. S. & Mckenzie, B. Vapor transport in unsaturated soil columns: Implications for vapor extraction. Water Resour. Res. 28, 323–335 (1992).
19. Haghighi, E., Shahraeeni, E., Lehmann, P. & Or, D. Evaporation rates across a convective air boundary layer are dominated by diffusion. Water Resour. Res. 49, 1602–1610 (2013).
20. J. R. Meier, L. W. Chang, S. Jacobs, J. Torsella, M. C. Meckes & M. K. Smith. Use of plant and earthworm bioassays to evaluate remediation of soil from a site contaminated with polychlorinated biphenyls. Environ. Toxicol. Chem. 16, 928–938 (1997).
21. Shokri, N. & Or, D. What determines drying rates at the onset of diffusion controlled stage-2 evaporation from porous media? Water Resour. Res. Chem. 47, 1–8 (2011).
22. Lehmann, P., Assouline, S. & Or, D. Characteristic lengths affecting evaporative drying of porous media. Phys. Rev. E – Stat. Nonlinear, Soft Matter Phys. 77, 1–16 (2008).
23. Carminati, A., Kaestner, A., Lehmann, P. & Flühler, H. Unsaturated water flow across soil aggregate contacts. Adv. Water Resour. 31, 1221–1232 (2008).
24. Wang, Y., Merlin, O., Zhu, G. & Zhang, K. A Physically based method for soil evaporation estimation by revisiting the soil drying process. Water Resour. Res. 55, 9092–9110 (2019).
25. Shahraeeni, E., Lehmann, P. & Or, D. Coupling of evaporative fluxes from drying porous surfaces with air boundary layer: Characteristics of evaporation from discrete pores. Water Resour. Res. 48, 1–15 (2012).
